Friday, August 31, 2012

Fri, Aug 31: /SI, /GC, MA. Reaction to Bernanke.


The New York equity markets rallied today, Fri Aug 31, reacting to a non-committal speech (re: further quantitative easing [QE]) by Ben Bernanke at Jackson Hole with moderate gains of about half a percent.

There was more drama in the precious metals markets, as might be expected given these securities' recent use as betting vehicles on QE. The brightest fireworks happened in silver futures (/SI), which rallied to close right on the resistance point of a robustly-defined, 15-month price channel.

/SI. Jan 2011 to present. Daily candles.
Of note is the particularly robust definition of this 15-month channel. The upper line, to a dime or less, connects the intra-day highs of May 1, 2011 (the multi-year high in silver) and two subsequent local maxima (mid-Aug 2011 and late-Feb 2012). The lower parallel line connects a few local minima, again to remarkable precision, and was only violated during silver's catastrophic sell-off in September 2011, and then only on an intra-day basis.

In short, this price-channel set-up is about as elegant as might be imagined. But that does not imply that today's close of $31.79 is destined to be another local maximum; price may break through on its bullish momentum, in which case a continuation of the rally is likely, possibly after a throwback to today's price.

Gold futures (/GC) also rallied today. Further quantitative easing risks debasement of paper currencies like the US Dollar, and so the price of gold (which is quoted in USD, after all) stands to gain. Today's price action propelled gold futures through the resistance end of a three-month price channel. On the four-hourly-candles chart, gold is further above its 200-period simple moving average (SMA) than it has been since the winter.

/GC. Dec 14, 2011 to present. 4-hourly candles.
Mastercard Inc (MA) has quite intriguing price action on its daily-candles chart: volatility is sharply reduced over the past month, price is struggling to hold the support of a two-year channel, and value is about as close to the 200-period SMA as its been in 18 months. All three observations suggest that bears are poised to get the upper hand, although any pull-back is likely to be temporary, with price action having been above the 200-period SMA since January 2011.

MA. Sept 2010 to present. Daily candles.

Thursday, August 30, 2012

Thurs, Aug 30: AAPL, CTRP, FSLR, VXN


Markets are somewhat more volatile today, in anticipation of tomorrow's Jackson Hole speech by Fed chairman Ben Bernanke.

Apple (AAPL) shares have broken below a well-formed one-month price channel that had propelled the shares upward by 20 percent. Such a violation of channel support is not necessarily bearish, however. An important consideration is the slope of the channel, with violations of steep channels more likely to bring about consolidation rather than reversal.

AAPL. July 23 to present. Hourly candles.
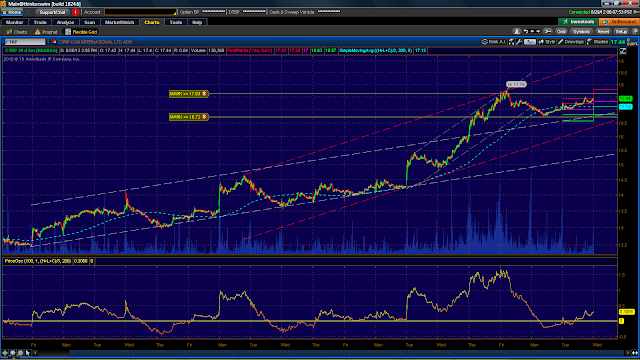
Ctrip.com International (CTRP), a regular of these pages, appeared strongly bullish as recently as two days ago. Today's price action, however, has brought shares of the Chinese online travel agency to below a price channel encapsulating the last fortnight of data. The technical picture is not unlike that of AAPL above -- i.e. the violation of support from a steeply up-sloping channel -- and the outlook for consolidation is similar. The hawk-eyed reader might notice a short-lived but interesting throwback to the violated channel, occurring around midday today; this blog recently discussed throwbacks with regard to Dentsply (XRAY).

CTRP. Aug 6 to present. 5-minute candles.
First Solar Inc (FSLR) has reversed in dramatic fashion today. The shares rallied very strongly after a well-received earnings report at the beginning of the month, but for the week up to and including this Tuesday, had ground only modestly higher each day on decreased volatility. Such a combination -- token gains on sharply decreasing volatility -- is often a red-flag of forthcoming volatility expansion and, often, sharp declines.

FSLR. Aug 6 to present. 5-minute candles.

The implied volatility on NASDAQ-100 options (VXN) is today consolidating immediately below the resistance side of a 3-month price channel. Per the CBOE, the VXN "measures the market's expectation of 30-day volatility implicit in the prices of near-term NASDAQ-100 options. VXN is quoted in percentage points, just like the standard deviation of a rate of return, e.g. 19.36."

As such, the VXN indicator is analogous to the VIX, which tracks implied volatility on S&P500 options; and VXD, which provides a reading of implied volatility on DJIA options. Of note is that the measured implied volatility is of options tracking the indices themselves, not a weighted measure of implied volatility on the options of the index-constituting securities themselves.

While VXN price action is just below 3-month resistance, VIX and VXD have already broken through their analogous 3-month channels. (Charts of VIX and VXD are not shown.) 

VXN. Dec 13, 2011 to present. Hourly candles.


Wednesday, August 29, 2012

Tues, Aug 28: ALTR, CTRP, EA, KFT, XLNX


Markets continued to flatline on Tues, Aug 28, although the charts of several securities were quite interesting.

Altera Corp (ALTR), perhaps the quintessential NASDAQ-100 company (it makes semiconductors, is based in Silicon Valley, and has its headquarters on "Innovation Drive"), has penetrated price-channel resistance on both the daily-candles and hourly-candles charts. From the daily-candles chart, price action above $37.5 would be bullish, that price being approximately the August high.

ALTR. Jan 2011 to present. Daily candles.
ALTR. Dec 12, 2011 to present. Hourly candles.

Ctrip.com International (CTRP) continues to look bullish despite last week's 20 percent rally. From the 5-minute candles chart, price action is consolidating near the top of its recent range and appears to be forming a bull pennant pattern. Switching focus to the hourly candles perspective, price is continuing to consolidate beneath a six-month trendline.

CTRP. Aug 2 to present. 5-minute candles.
CTRP. Mar 1, 2012 to present. Hourly candles.
The daily candles chart of Electronic Arts (EA) is showing an almost-completed throwback to a recently-penetrated, nine-month price channel. This blog very recently covered another instance of a throwback, occurring in shares of Dentsply (XRAY).

EA. Mar 2010 to present. Daily candles.
Kraft Foods Inc (KFT) has quite the spectacular four-year, daily-candles chart; nearly all price action since May 2009 is contained in a single, well-fitting price channel. Notably, price behavior during the past two sessions is hugging the channel's resistance end.


KFT. Aug 2008 to present. Daily candles.
 Xilinx Inc (XLNX), a NASDAQ-100 component in the specialized semiconductors industry, is testing the resistance of a nine-month price channel. A break above approximately $34.16 would be bullish.

XLNX. Dec 12, 2011 to present. Hourly candles.

Sunday, August 26, 2012

Fri, Aug 24: CTRP, LIFE, SPLS, XRAY


US Markets closed the week with gains, with the S&P500 up 0.7 percent to 1411.

Ctrip.com International (CTRP), the Chinese travel agency and NASDAQ-100 component that was highlighted on these pages a few days ago for bullish potential, exploded higher during the week. Price action accelerated upward in capitulatory buying that suggested a short squeeze, and volume was heavy. The advance finally halted on the 24th at a six-month trendline.

CTRP. Jan 19, 2012 to present. Hourly candles.
Drilling down to the 5-minute candles perspective on CTRP, the rally's acceleration is clearly visible. It's quite interesting to observe how bulls pounced just upon the stock's upward break from its 15-day, upward-sloping channel. Such action confirms that the channel was a valid model of the security's support and resistance levels; as price breached resistance (i.e. the channel's upward boundary), new demand materialized and the velocity of price appreciation increased.

CTRP. July 31 to present. 5-minute candles.
Life Technologies Corp (LIFE), a NASDAQ-100 biotech, is tightly consolidating immediately under the resistance side of a 3-year price channel, a bullish development. A break above this month's highs of approximately $47.50 would signify a successful channel break and be a significant bullish omen.

LIFE. Aug 2008 to present. Daily candles.
Staples Inc (SPLS), the office supplies retailer, is in a precipitous post-earnings sell-off that commenced in mid-August. The bearish move has brought shares to the support zone of a 4-year channel. Caution is particularly warranted with regard to this set-up, though; the channel is characterized by violations that, while small, can nonetheless cause considerable pain for the leveraged hedgie. For instance, the local minimum of Oct 2008 strayed below the price channel boundary by about fifty cents.

SPLS. Aug 2008 to present. Daily candles.
A zoomed-in appraisal of SPLS confirms the potential for a contrarian long trade. Price action is hugging the support of a 6-month channel, and a capitulatory break below could potentially evolve into a bear trap and subsequent short-squeeze rally.

SPLS. Dec 8, 2011 to present. Hourly bars.
Dentsply International Inc (XRAY), a dental instruments and supplies manufacturer and NASDAQ-100 component, is exhibiting a phenonemon that this blog finds particularly interesting: a throwback to support, alternatively known as the kiss of death. This occurrence is fascinating as it powerfully showcases the remarkable tussle between fear and greed, bulls and bears, that is the essence of price action. Whereas market participants' dominant sentiment was recently sufficiently powerful to overtake a support or resistance area, a surge of the opposite sentiment is on display during a throwback.

The hourly candles chart of XRAY shows the security breaking through a downward-sloping channel in early August. The channel, depicted below in grey, was particularly well-formed; the lines touch several local price extrema to the penny, and the eventual break was sufficiently significant to catalyze a particularly vertiginous one-day rally. On August 23rd (the second to last day of price action in the below screenshot), however, price retraced all the way back, with the intraday low falling on the price channel boundary: the throwback!

XRAY. Dec 8, 2011 to present. Hourly candles.

Thurs, Aug 23: BA, DELL, KO, WCRX


Markets on Aug 23 continued their reaction away from 4-year highs, with S&P500 futures notably breaking below 1400 although closing above that level.

Boeing (BA) was a considerable laggard on the DJ Industrial Average, falling 3.3 percent in response to a cancellation of Boeing 787-9 orders by the Australian airline Qantas. The decline brought BA to just above a significant, 3-year price channel. The channel support may not prove durable, though, and a break by $2-3 is a definite possibility given the selling climaxes of about 12 months ago, which pierced the same channel by about that amount.

BA. Aug 2008 to present. Daily candles.
Computer maker Dell (DELL) is likewise experiencing bearish drama, falling to a 3-year low. On the hourly candles chart, meanwhile, DELL is at support from a 3-month channel. Although robustly defined, this channel is nonetheless suspect due to its quite moderate slope, which may make the trendline more likely to fail.

DELL. Aug 2008 to present. Daily candles.
DELL. Jan 27, 2012 to present. Hourly candles.
Coca Cola (KO) is also interacting with support from an approximately quarter-year price channel. Unlike DELL's channel of a similar time frame, in which both boundaries are defined by at least three points, KO's channel is formed in decidedly more minimal fashion and, as such, is less likely to produce durable support.

KO. Dec 7, 2011 to present. Hourly candles.
Warner Chilcott (WCRX), the pharmaceutical company and NASDAQ-100 component, has pierced above a four-month price channel, albeit rallying through the resistance on only moderate volume. Price action performed a similar feat last week, but that rally fizzled and produced a bull trap, which colors this recent bullish move in a similarly suspect light.

WCRX. Apr 16, 2012 to present. Hourly candles.


Thursday, August 23, 2012

Baidu (BIDU) in a sharp sell-off


As S&P500 futures flirt with the 1400 mark in today's session, Baidu (BIDU) shares are continuing their four-day sell-off in earnest. The last few minutes suggest capitulation.

The one-minute candles chart shows the marked nature of the last hour's high-volume selling. Shifting perspective to the daily candles chart, significant price channel support is still considerably distant, just above $105. This two-year vantage point also reveals that price has failed to hold the 200-day simple moving average, which the August rally had just managed to take.

BIDU. Aug 22 to present. 1-minute candles.

BIDU. Jan 2011 to present. Daily candles.

Wednesday, August 22, 2012

Wed, Aug 22: AAPL, GC, MA


Markets today, August 22, were highlighted by the release of Fed meeting minutes, which significantly increased the market's assessed likelihood of a further QE round, causing stocks and bonds to rally.

Apple (AAPL) continues to remain in the spotlight. Just two days ago, the firm became the most valuable public company in (meaningless) nominal terms; adjusted for inflation, the Microsoft of the 1990s still reigns. The hourly-candles chart of AAPL shows the stock is intensifying its rally, having broken above an ascending, three-month price channel on Monday, on high volume to boot. Driving demand is, of course, the forthcoming iPhone 5 unveiling, estimated to occur on September 12. The lead-up fortnights to past iPhone launches have not witnessed parabolic price ascents, though, which colors recent price appreciation in a risky light.

AAPL. May 1, 2012 to present. Hourly candles.
Gold popped today, continuing a rally from $1620 an ounce that began yesterday, with the rally naturally spurred by the increased likelihood of further government asset purchases, a move that is widely interpreted as a debasement of paper currencies. There is likely to be selling pressure just below $1680, although it may prove quite short-lived as the medium-term outlook for gold appears bullish.

GC. Dec 5, 2011 to present. Hourly candles.
Mastercard (MA) shares, meanwhile, are setting up for a pierce of a two-year price channel; recent price advances have occurred on low volume, and the rate of appreciation is diminishing. It may not be an opportune moment for shorting MA, though. Breaks of relatively steep, upward-sloping trendlines often do not lead to outright price declines but merely to sideways consolidation. Investor sentiment remains bullish: MA is still somewhat above its 200-day simple moving average and last dipped below the 200SMA in January 2011.

MA. Aug 2008 to present. Daily candles.

Altria (MO). Been dying to own shares of a cigarette maker?


Altria Group (MO), the company formerly known as the Philip Morris Companies Inc., has arrived at price channel support on the hourly candles and 5-minute candles charts. As technical analysis is generally agnostic with regard to company fundamentals and product, this blog shares this development despite what many consider to be the company's deplorable industry (cigarettes, addiction, premature death: take your pick).

That said, MO's steep sell-off over the past two sessions, occurring on high volume, is certainly a cautionary signal. Many consider distribution days as dark omens, but not necessarily as signals of imminent breakdown.

MO. Dec 5, 2011 to present. Hourly candles.
MO. July 25 to present. 5-minute candles.

Tues, Aug 21: CTRP, EXPD, GMCR, SYMC, LMT


Volatility registered a definite uptick in today's New York trading, with the S&P500 touching a fresh 4-year high (surpassing the previous high-water mark of 1422, set on April 2 of this year, by four points) before selling-off into the close.

This evening's chart wrap-up focuses on five different equities: NASDAQ-100 components CTRP, EXPD, GMCR and SYMC, and S&P-100 component LMT.

Ctrip.com International (CTRP), a Chinese travel agency, has been in a lengthy bear market. The hourly-candles chart, stretching back to December 2011, shows a painful halving of the stock price; moreover, the bear market extends back to late 2010, when CTRP was a fifty dollar stock. The past month has seen a strengthening rally, with waves of buying reaching ever higher and volume growing on the advances. The buying may continue to the six-month price channel boundary, presently about a dime below $16. A break above is likely to portend continuation still higher. The truculent bear should review the last several weeks of First Solar (FSLR) price action.

CTRP. Dec 2, 2011 to present. Hourly candles.
Expeditors International (EXPD) is likewise looking up. Price action has just broken through a six-month price channel, having surpassed the 200-period simple moving average (based on hourly candles) about a week ago.

EXPD. Dec 2, 2011 to present. Hourly candles.
Green Mountain Coffee Roasters (GMCR), another FSLR-like day-trading vehicle, is continuing its own post-earnings rally. Resistance from a 6-month price channel is likely to provide a pause; it's only about three percent above today's closing price.

GMCR. Dec 2, 2011 to present. Hourly candles.
Symantec Corp (SYMC) is likewise interacting with a significant price channel -- in this case, with a 15-month variety. Price has consolidated just underneath for the past three sessions, showing that the bulls are still in firm control. A break higher is more likely than it appeared late last week.

SYMC. Aug 2008 to present. Daily candles.
Lockheed Martin (LMT), the defense contractor, may be in a capitulatory rally; bulls should take note and consider hedging. On the hourly-candles chart, price action has vaulted the equity right to the resistance end of an exceptionally well-formed 3-month price channel; volatility has contracted, suggesting a regression to the mean is overdue (and volatility expansion almost invariably brings lower prices). This over-bought sentiment is confirmed on the daily-candles chart, where price is precisely at 3.5-year price channel resistance, albeit vis-a-vis a channel that is only modestly well-formed.

LMT. May 23, 2012 to present. Hourly candles.
LMT. Aug 2008 to present. Daily candles.

Tuesday, August 21, 2012

Mon, Aug 20: EA, EXPE, FSLR, INTU


As the Aug 21 market day has just started, here's an abridged overview of some interesting charts from yesterday's trade (Aug 20). All four securities charted below are NASDAQ-100 components.

Electronic Arts (EA) is in a heady rally on the 20-day chart. Yesterday's market action saw a pull-back, and price found support precisely at the 18-day price channel.

EA. July 24 to present. 5-minute candles.
Expedia (EXPE) has recently been in a modest bearish consolidation after a strong gap up on July 27 following a well-received earnings report. In August 20 afternoon trade, price action tentatively pierced the resistance side of a price channel, which augurs well for a further advance.

EXPE. July 24 to present. 5-minute candles.
First Solar (FSLR) is a staple of short-term traders. August 20 trade saw FSLR rally beyond a moderately-defined 4-year price channel, on high volume no less.


FSLR. April 2008 to present. Daily candles.
Intuit (INTU), meanwhile, is exhibiting an interesting consistency on the hourly-candles chart with regard to forming short-lived wave patterns, especially since mid-May. The frequency of the wave is about 8 to 10 market sessions.

INTU. Dec 2, 2011 to present. Hourly candles.

Friday, August 17, 2012

Fri, Aug 17: LINTA, LVNTA


In mid-morning trade today, August 17, a few words about an intimate stock pairing: LINTA and LVNTA.

(And a question: does consonance carry across the blogosphere?)

The two equities are joined by more than just nearly identical symbols; LVNTA is in fact a spin-off of LINTA. But this post is not about corporate structure or governance. The charts are what matter.

LVNTA shares were issued just a week ago, on Friday, August 10. Each LINTA share was assigned 0.05 share of LVNTA. Based on the spin-off's opening price of $40, one would expect the parent to gap down about 0.05*$40, or $2, as though the underlying instrument were going ex-dividend, and so it approximately did. Interestingly, a three-month price channel supported the day's low almost to the penny -- even though the day's "sell-off" was caused not by an influx of bearish sentiment but, rather, by a mathematical identity.

LINTA (the parent). May 9, 2012 to present. Hourly candles.
Shares in the spin-off, LVNTA, look particularly interesting at the present mid-morning moment. The shares, of course, have very limited price action off of which to base a technical analysis hypothesis; and yet bullish price consolidation around the upper end of a five-day price channel is unmistakable. Volume is confirming the sentiment: a high volume capitulatory sell-off late yesterday was followed by a high volume rally this morning. The parent company, LINTA, is also rallying hard from intraday lows.

LVNTA (the spin-off). August 10, 2012 to present (all historical price action). 2-minute candles.

Thurs, Aug 16: GC, CL, DLTR, S


A few notable charts of Aug 16 market action beg for sharing, and no matter that I'm scribbling together these few words just before the market open on the 17th.

Gold futures (GC) are setting up for a potential appreciation. The one-year, daily candles chart shows that the contract is nudging against a complex, three-lined price channel that stretches back to the market peak in September of last year. A break higher above the channel is likely, although it may spawn only a limited rally if Bernanke and Trichet fail to turn on the QE spigot. They'll be making the annual pilgrimage to Jackson Hole at month's end, and the coiling GC price action may be, in part, a reflection of this.

GC. July 1, 2011 to present. Daily candles.
Light sweet crude oil futures (CL) may be reaching the exhaustion point of their six-week rally, as suggested by two pieces of evidence. First, price is reaching a "kiss of death" with a moderately-defined, four-year price channel. The KoD occurs when price violates a trendline, as happened with CL in May of this year, and then comes back to touch it. Second, the KoD would coincide quite closely with the 200-day simple moving average and with a 61.8% Fibonacci retracement from the June low to the February high. 

CL. August 2008 to present. Daily candles.
For a final chart, consider Dollar Tree (DLTR), a NASDAQ-100 component. Shares are in a prodigious four-year rally, although they took a heavy, high volume stumble on the 16th. And where did the intra-day low fall? -- on the four-year price channel, to the penny.

DLTR. August 2008 to present. Daily candles.
Stop the presses; one more chart. Following up on the depiction of Sprint Nextel (S) in the post of August 13, here's how action has proceeded to play out. Allow this morsel of self-congratulation: the advance halted at $5.49, brilliantly in accordance with my call of "just below $5.50".

S. August 2008 to present. Daily candles.

Tuesday, August 14, 2012

Mon, Aug 13: VIX, VXN, S, VOD


Major contrarian signal alert: after a pummeling today, the major options pricing -based market volatility indices are at record lows. A 5-year chart of the VIX, the CBOE volatility index based on options pricing for stocks of the S&P500 index, reveals that today's close of 13.7 is only a whisker above the 5-year low, set in March of this year (at the market top, needless to say).

VIX. August 2008 to present. Daily candles.

One of the less-discussed cousins of the VIX, the VXN, itself based on options pricing for stocks of the NASDAQ-100 index, today set an outright new 5-year low. Market technicians often interpret the VIX and its derivatives as contrarian indicators, meaning that the present low levels in these instruments add evidence to the hypothesis of forthcoming bearishness for equities.

VXN. August 2008 to present. Daily candles.

Among interesting charts of equities are those of Sprint Nextel Corp (S) and Vodafone (VOD). Coincidentally, both companies are, of course, telecoms; both are also members of the NASDAQ-100. As suggested by the above chart of the VXN, the proxy measure of anticipated NASDAQ-100 volatility, both S and VOD are rallying. S, notably, is in a steep and relatively high-volume bullish spike. A nearly three-year price channel suggests potential resistance just below $5.50.

S. August 2008 to present. Daily candles.

Vodafone, meanwhile, has exhibited a curious relationship between its open and close prices over the last month. Over the last 24 trading days, the open has been below the close on only 3 occasions. Moreover, on only one occasion has the close been more than 10 cents below the open. Notably, VOD is an ADR (American depositary receipt) type of equity; its primary listing is on the London Stock Exchange (LSE), and as such, the American ADR experiences many gap days, given that LSE trading of Vodafone shares starts several hours before New York price action commences. Against the backdrop of the Eurozone crisis (which has had its share of headlines over the last month), perhaps the trend is for European pessimism to yield to American optimism?

VOD. Jul 11, 2012 to present. Daily candles.