The New York equity markets rallied today, Fri Aug 31, reacting to a non-committal speech (re: further quantitative easing [QE]) by Ben Bernanke at Jackson Hole with moderate gains of about half a percent.
There was more drama in the precious metals markets, as might be expected given these securities' recent use as betting vehicles on QE. The brightest fireworks happened in silver futures (/SI), which rallied to close right on the resistance point of a robustly-defined, 15-month price channel.
 |
| /SI. Jan 2011 to present. Daily candles. |
In short, this price-channel set-up is about as elegant as might be imagined. But that does not imply that today's close of $31.79 is destined to be another local maximum; price may break through on its bullish momentum, in which case a continuation of the rally is likely, possibly after a throwback to today's price.
Gold futures (/GC) also rallied today. Further quantitative easing risks debasement of paper currencies like the US Dollar, and so the price of gold (which is quoted in USD, after all) stands to gain. Today's price action propelled gold futures through the resistance end of a three-month price channel. On the four-hourly-candles chart, gold is further above its 200-period simple moving average (SMA) than it has been since the winter.
 |
| /GC. Dec 14, 2011 to present. 4-hourly candles. |
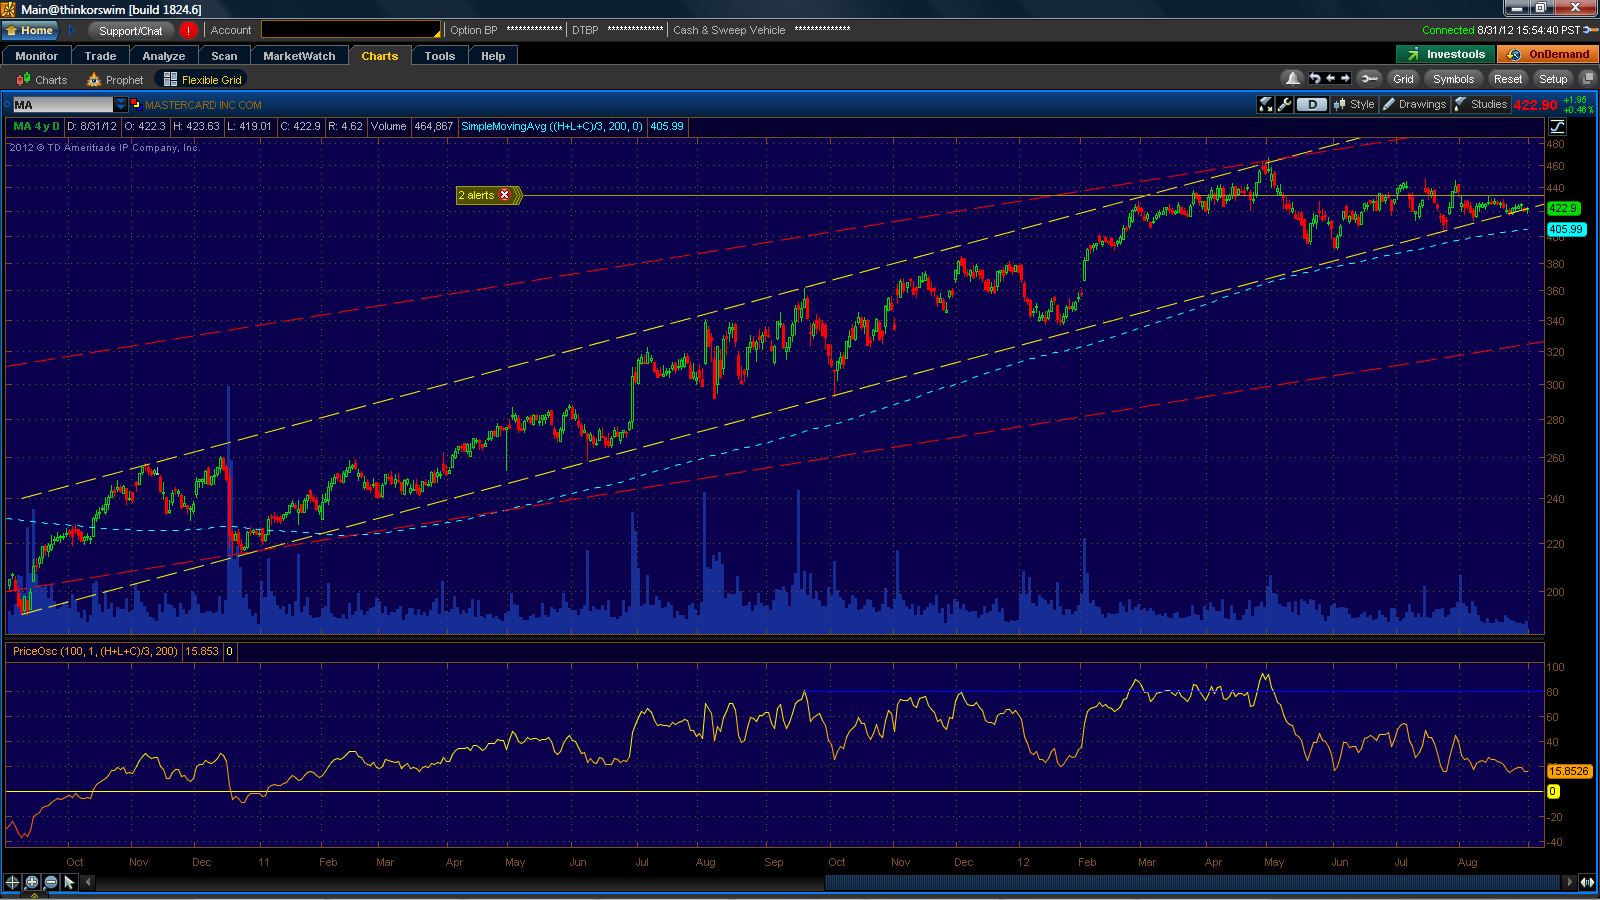 |
| MA. Sept 2010 to present. Daily candles. |